Best Practices for Spreadsheets
Or, How I Learned to Stop Worrying and Think Like R
Learning objectives
- Understand how to format raw data to be “tidy”
- Know common data formatting/data entry mistakes to avoid
- Introduction to dates as data
This lesson is adapted from Data Carpentry’s Data Organization in Spreadsheets for Ecologists.
Formatting
- Never modify your raw data. Always make a copy before making any changes.
- Keep track of all of the steps you take to clean your data in a plain text file.
- Organize your data according to tidy data principles.
- Each column is a variable like “weight” or “site_ID”
- Each row is a single observation
- Don’t combine pieces of information in a single cell
This is bad:
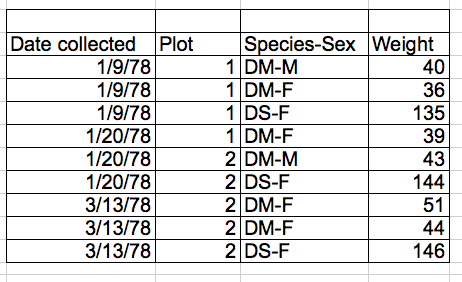
Why? Species and sex should be split into separate columns.
Avoiding Common Mistakes
Avoid using multiple tables within one spreadsheet.
Avoid spreading data across multiple tabs.
- Programs other than Excel will have a tough time seeing tabs
- Instead of adding a new tab, keep adding rows, and maybe use a new column for the info you’d be splitting across tabs. For example, use a column for Year instead of a new tab for a new year.
- If your table gets big, freeze your column headers to make them easier to see while you scroll.
Record zeros as zeros.
- Zeros are data! Don’t use blanks, and don’t use zeros as null values
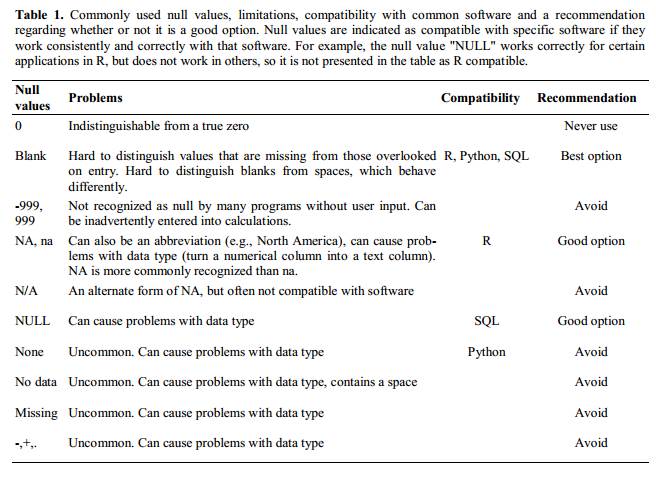
Use an appropriate null value to record missing data.
- There’s a broader discussion of this in White et al 2013, but here’s a quick look at their recommendations:
Don’t use formatting to convey information or to make your spreadsheet look pretty.
- R won’t see cell colors or bold fonts
- Keep data as characters or numbers
Place comments in a separate column.
- Don’t use Excel’s “comments” functionality, other programs don’t recognize these
- Just use a separate text column
Record units in column headers.
- Don’t put units in your data cells!
- 10cm will be read as characters, not numbers
Include only one piece of information in a cell.
Avoid spaces, numbers and special characters in column headers.
Good Name
Good Alternative
Avoid
Max_temp_C
MaxTemp
Maximum Temp (°C)
Precipitation_mm
Precipitation
precmm
Mean_year_growth
MeanYearGrowth
Mean growth/year
sex
sex
M/F
weight
weight
w.
cell_type
CellType
Cell Type
Observation_01
first_observation
1st Obs
- Avoid special characters in your data.
- Copy-pasting text into cells (ex. from Word) can do weird stuff
- Record metadata in a separate plain text file.
- When in doubt, use a README
- Put metadata in same directory as the data file itself, with an appropriate name
Dates as Data
- Excel was apparently created by people who hate time
- Excel stores dates in several different ways
- For Windows, it stores dates as number of days since Jan 1 1900
- For Mac, it stores dates as number of days since Jan 1 1904
- Check for dates that are ~4 years off
- Excel’s base is to store dates as numbers, but it dresses them up in different ways, like 9/1/2018 or Sept-1-2018
- Excel will often take one entry (Jul-10 for the 10th of July) and interpret it as another (1-July-2010)
- It will even coerce data that aren’t dates into dates
- You have to be very careful, because Excel won’t tell you when it does things like this
- Treating dates as multiple pieces of data rather than one makes them easier to handle.
- Use separate columns for year, month, and day
- You can also use columns for year and day-of-year (1 to 365)
- Ultimately, avoid letting Excel handle dates, it’s hard to know what it will do
Quality Control
- Always copy your original spreadsheet file and work with a copy so you don’t affect the raw data.
- It can be helpful to have separate “Raw” and “Clean” data folders
- Use data validation to prevent accidentally entering invalid data–this can be especially useful if you have others entering data for you.
- Select the cells or column you want to validate
- On the
Datatab selectData Validation - In the
Allowbox select the kind of data that should be in the column. Options include whole numbers, decimals, lists of items, dates, and other values. - You can then give a range of values or enter a comma-separated list of allowable values in the
Sourcebox - You can use the
Input Messagetab to customize the error message given when an incorrect value is entered
- “Sorry faithful undergraduate field assistant, we only have plots 1-10”
- You can make incorrect values throw warnings instead of errors using the
Styleoption on theError Alerttab
- Use sorting to check for invalid data.
- Use conditional formatting (cautiously) to check for invalid data.
- Conditional formatting can color cells based on their value
- You can then visually scan for strange values
- Can be useful, but definitely not foolproof
Exporting Data
- Data stored in common spreadsheet formats will often not be read correctly into data analysis software, introducing errors into your data.
- try not to use .xls or .xlxs or .xxlsxlsxlllslxlsllaslxl or whatever
- Exporting data from spreadsheets to formats like CSV or TSV puts it in a format that can be used consistently by most programs.
- Not only will this be easier for R to read, but it is widely recognized and will likely be around for a long time
- CSV and TSV are, ultimately, plain-text files, which are simple and classy and timeless
Put It All Together
Exercise
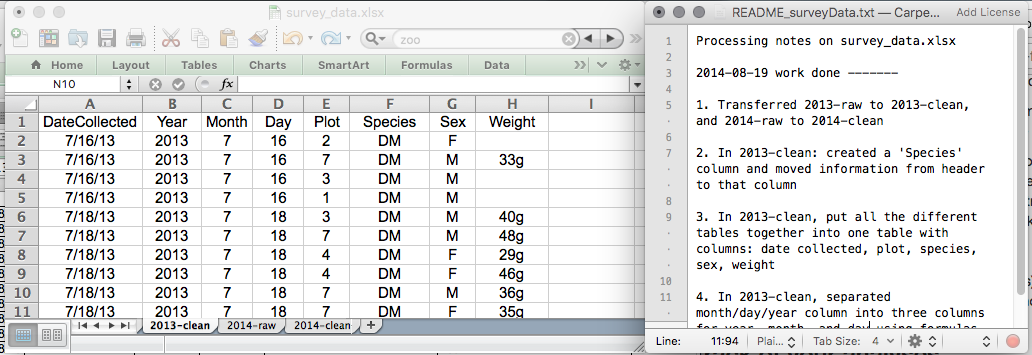
We’re going to take a messy version of the survey data and describe how we would clean it up.
- Everyone should already have the data file on your computer in your R_DAVIS_2020 project in a folder called
data - Navigate to the
datafolder in your File Explorer (Windows) or Finder (Mac) - Open up the data in a spreadsheet program.
- You can see that there are two tabs. Two field assistants conducted the surveys, one in 2013 and one in 2014, and they both kept track of the data in their own way. Now you’re the person in charge of this project and you want to be able to start analyzing the data.
- With the person next to you, identify what is wrong with this spreadsheet. Also discuss the steps you would need to take to clean up the 2013 and 2014 tabs, and to put them all together in one spreadsheet.
Important: Do not forget our first piece of advice: to create a new file (or tab) for the cleaned data, never modify your original (raw) data.
After you go through this exercise, we’ll discuss as a group what was wrong with this data and how you would fix it.